Graph
Builder Addon lets you generate 3D Bar Graphs from simple values. The bars can have
simple animation.In this tutorial,I will be making a simple 3D graph in blender with
this Addon.
You can download the addon on Github and download the data that I
am going to use and end result from here, in case you want to follow along . Though you can use any
data you want, just make sure data values are integer and each value is
separated by a comma.
Just to give you an idea Graph Builder addon work like
this.

Installation
Just
extract the file. Open Blender and go to user preferences and select “install
from the file”. Then locate and choose the graph.py file.
Tutorial:
There are 4
panels in the addon.
We will go
to them one by one and see what are their usage.
Step1:
Copy
Data into the data values and set the factor.
Here, you
want to enter the values that will be used to draw the graph. Each value represents
a bar on the graph. Values must be separated with a comma (,).
I am just
copy pasting the data.

Factor: The
size of the bars in graph is calculated by multiplying the respective value
with the factor.
If
Factor<1 : Graph will be smaller in size.
If
Factor> 1: Graph will be bigger in size.
My values
are way too big. So, I will set the factor to 0.001.
Step2:
Set
the coordinates, gap and grid for graph
Set the
origin.
I will also
create bases So I will set the OriginZ = 3 to make enough space for the base.
Gap will be
the gap between the bars. I will set it to 6.5 in this case.
Set the
grid size. [Caution: Grid doesn’t work properly now] . I will leave it as is as
I don’t need it in my graph also for now it just generates a not_to_scale grid,
hopefully by the time you read this it works fine but for now it would be
better to not to use it.
Set the
initial size for bars. It is the size initial size of bars when the animation
starts. If you are not going to animate it leave it as is. I will set it to 0.

Step3:
Each
bar can have a simple scaling animation(from initials size to the real size).Now
in animation panel you have three options,
1. Animation checkbox: check it to
animate the graph.
2. Animation Duration: Set the
Animation Duration
3. Animation Delay: The delay between
the animations of each bar.

Step4:
You can have a base for each of the bars. I
will copy the country names here.
Important: Make sure the Gap
option in graph panel is unchanged when generating the base. Also, the OriginZ
set accordingly.
You can adjust the origin and gap
for bars from the graph panel. And Text position from text panel before
pressing the generate button.

Step5:
Now,
the text panel have following options,
Text: This
will be the suffix of the Text.
Show Text
checkbox: Check it if you want to show the Text in case of the base and Values
in case of the graph.
Size: Size
of the text. I will set it 0.9
Position
Checkboxes: Set the position of text respective to the bar. I will check Top of
bar for the graph,
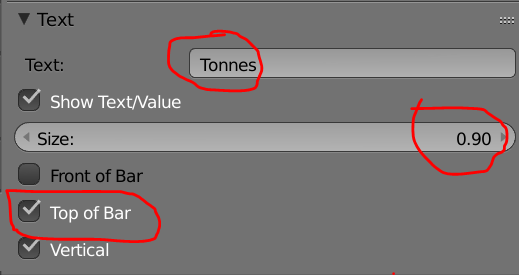
And front
of bar for the base. I will leave the text empty as i do not need suffix for the country names.

Now, click
the generate button in graph panel to generate the graph.
Then,
change the OriginZ to 0(as the base will be below the bars) and click generate
button in base panel.
If the
generated graph is not what you expected or you want to go back and change
something, just undo(ctrl+z) and change the values. So keep experimenting with
the parameters until you get the desired result.
After this, you can add materials,textures and headings or customize it manually.
In my case, I deleted the grid and added some materials and textures and here is the end result.

[The bases are already UV Unwraped so you can add any image texture easily.]
The add-on will get updated and updated .,I will try to update tutorial but if I am late follow the instructions on github. The add-on was created and currently is maintained by me so if you have and suggestion you can post them here in comments or at github .
I hope you find it useful. If you have any queries, please post them in the comments below.
Thank You Very Much!!:)
The add-on will get updated and updated .,I will try to update tutorial but if I am late follow the instructions on github. The add-on was created and currently is maintained by me so if you have and suggestion you can post them here in comments or at github .
I hope you find it useful. If you have any queries, please post them in the comments below.
Thank You Very Much!!:)
Bro can you tell how to convert the wikipedia table data into format you have in the Data.txt
ReplyDeleteTo copy table column just download copy tables addon for chrome from web store
ReplyDeleteThen format that data you can use following Python script
#paste the data into string.
string = ""
string = string.replace(',','')
string = string.replace(" ",",")
This should work let me know Thank:)
can you show how to access the graph panel on Windows 10, Blender 2.93
ReplyDeleteAntalya
ReplyDeleteKonya
Adana
Ankara
Van
EGD
ağrı
ReplyDeletevan
elazığ
adıyaman
bingöl
M6İ
yozgat
ReplyDeletesivas
bayburt
van
uşak
O8XQ
kırıkkale evden eve nakliyat
ReplyDeleteamasya evden eve nakliyat
kayseri evden eve nakliyat
istanbul evden eve nakliyat
sakarya evden eve nakliyat
1K34H
adana evden eve nakliyat
ReplyDeleteafyon evden eve nakliyat
istanbul evden eve nakliyat
burdur evden eve nakliyat
gümüşhane evden eve nakliyat
WC5K76
538BE
ReplyDeleteİstanbul Lojistik
Mersin Parça Eşya Taşıma
Bitexen Güvenilir mi
Rize Parça Eşya Taşıma
Osmaniye Lojistik
Bingöl Lojistik
Sivas Şehirler Arası Nakliyat
Tokat Şehir İçi Nakliyat
Niğde Şehir İçi Nakliyat
2E5BB
ReplyDeleteMalatya Lojistik
Batıkent Fayans Ustası
Bitexen Güvenilir mi
Hakkari Evden Eve Nakliyat
Bilecik Şehir İçi Nakliyat
Çankırı Şehir İçi Nakliyat
Edirne Parça Eşya Taşıma
Flare Coin Hangi Borsada
Kırşehir Lojistik
976DC
ReplyDeleteAfyon Sesli Sohbet Mobil
Gümüşhane Sesli Sohbet Sesli Chat
Afyon Canlı Görüntülü Sohbet Odaları
en iyi sesli sohbet uygulamaları
kastamonu rastgele görüntülü sohbet
siirt sohbet odaları
canlı sohbet siteleri ücretsiz
ısparta sesli sohbet sesli chat
Denizli Sesli Görüntülü Sohbet
D2656
ReplyDeleteşırnak telefonda görüntülü sohbet
kayseri canlı sohbet odaları
bartın görüntülü sohbet siteleri ücretsiz
Aydın Canlı Sohbet Siteleri Ücretsiz
görüntülü sohbet kızlarla
Aksaray Yabancı Sohbet
ağrı rastgele sohbet siteleri
hatay kadınlarla rastgele sohbet
kocaeli ücretsiz görüntülü sohbet uygulamaları
1A9DC
ReplyDeletetrezor suite
dao maker
uwulend finance
debank
pinksale
sushiswap
avalaunch
zkswap
dexview
A33F1718D0
ReplyDeletegarantili takipçi satın al
Kaspersky Etkinleştirme Kodu
Lords Mobile Promosyon Kodu
Stumble Guys Elmas Kodu
Township Promosyon Kodu
Binance Referans Kodu
Brawl Stars Elmas Kodu
Pubg New State Promosyon Kodu
Binance Referans Kodu
B1DF06A88D
ReplyDeletetelegram coin kazma
oyun oyna coin kazan
telegram coin botları
coin madenciliği
telegram coin kasma nedir